

Case Study
Delight Users & Maximize Adoption. UX Design.
Lorem ipsum dolor sit amet, consectetur adipiscing elit. Morbi vulputate aliquam ex, quis tincidunt neque faucibus volutpat. Nulla gravida imperdiet metus, in egestas nisl auctor nec.
Business Situation:
A private equity firm wanted to create an application that would enable their financial advisors to access internal databases to create their own dashboards and reports.
Solution Story:
Imaginet’s User Experience (UX) design team worked closely with the Business Intelligence team to understand the context of the tool within the work environment as well as the specific functionality they were looking to include. They performed several remote collaboration workshops with the team and discussed the concepts with a core group of users to facilitate alignment between those requesting the data and the BI team.
They used that information to create intuitive interfaces that highlighted key functionality while working within the technical structure of the environment.
User Experience (UX) Services:
- Workshops
- Focus Group
- Interaction Design & Prototyping
- Visual Design
Total Duration: 3 weeks
WORKSHOP SESSION
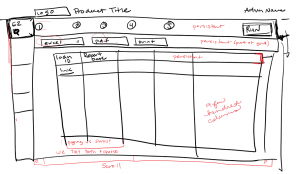
WIREFRAME
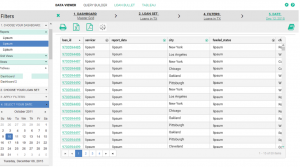
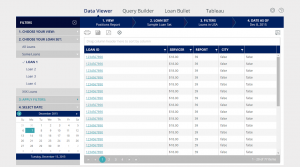
VISUAL DESIGN
Related Articles:
- Why Businesses Choose SharePoint for Their Enterprise Content Management System
- Imaginet SharePoint Service Offering
value provided
- FACILITATE INTERNAL TEAM ALIGNMENT
- INTUITIVE INTERFACE THAT INTEGRATED WITH TECHNOLOGICAL FRAMEWORK
- ACCELERATED CUSTOMER ADOPTION
Imaginet blog

What is Microsoft Dataverse?
As data is the center of how we build an application, Dataverse is designed to be a central data repository to help you get the most out of your data,…

Microsoft Power Pages
Discover the power of Microsoft Power Pages – an all-in-one web development and design tool that helps you create stunning websites and applications with ease. Boost your online presence and…

Using Fastlane to Expedite Application Development
Fastlane is a tool for automating app builds and distribution for both iOS and Android. By using a combination of lanes and actions, developers can simply build, sign and distribute…
Let’s build something amazing together
From concept to handoff, we’d love to learn more about what you are working on.
Send us a message below or call us at 1-800-989-6022.