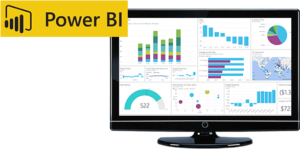
A provincial agricultural services corporation was experiencing challenges with its reporting solution. They were starting to use Power BI to replace operational reports that had previously used data from a DB/2 operational database. With data often duplicated and limited staff available to manage the data, they were encountering bottlenecks and governance issues. The client re-engaged Imaginet to help their team re-design their data analytics model and processes.
The client’s approach to replacing their existing reports with Power BI was to build each report with its own dataset from their new operational data store (ODS), which was now hosted in a SQL database. This led to many silos of similar data across multiple reports, and an inefficient report authoring process that did not easily reuse the data across multiple reports.
Imaginet’s approach was to build shared datasets in Power BI with multiple subjects, in a star-schema design with fact and dimension tables in Power BI that made it much easier to build many different reports. We showed how datasets can be endorsed in Power BI so they can be seen as having high quality and trustworthiness within the organisation. We added these shared datasets to source control to handle change tracking and provide a history of changes.
With the new solution, Power BI reports can be built from these endorsed datasets, and the business logic and data in the endorsed datasets is now consistently used. We configured Power BI in PowerPoint, drill through and drill down in reports, various buttons in reports, Role-based security, synonyms Q&A, and Power BI apps for collaboration with colleagues. The client can create personalized reports and subscribe to a specific report or dashboard in Power BI.
To ensure that reports had a consistent brand image, we created a style/theme document that formats elements like header alignment, decimal places, buttons, and colour sets for reports, saving the team hours of formatting work.
With the updated solution, the client can work with their data inside Power BI. Users can build reports themselves instead of waiting for IT team members to send them. The client’s data is trustworthy, with proper documentation and change tracking to keep things in check.
Our team has been working hard these last few months, and we are excited to share our success with you. Don’t forget to subscribe to our newsletter to stay updated on our most recent Microsoft 365 projects. Fill out the form at the bottom of the page if you would like to work with us and someone will be in touch.
discover more
Organizations are focusing on innovation, streamlining their processes, and delivering better experiences for employees and customers. Power Platform and SharePoint are the Microsoft products that are helping organizations focus on this type of transformation. When integrated effectively, they deliver powerful…
If you’ve ever dumped a giant problem into Copilot Chat and watched the conversation slowly turn into spaghetti, subagents are the feature you’ve been waiting for. Think of subagents as specialized mini-Copilots you spin up on demand. You hand them…
We’ve all heard of the cloud and cloud migration. But how important is it actually for your business? Organizations are moving to the cloud for several reasons: to improve agility, for better scalability, and to focus on cost efficiency. With…
Let’s Build Something Amazing Together
From concept to handoff, we’d love to learn more about what you are working on.
Send us a message below or drop us a line at 1-800-989-6022.


