

Creating Visualizations Using D3
May 9, 2024
Creating visualizations for applications can be overwhelming and difficult without using the correct tools. Recently, I faced a challenge where I needed to modernize a visualization from a legacy application that used a recursive function to display data dynamically. Creating visualizations for D3 allowed me to overcome that challenge.
What is D3?
D3 is a JavaScript library that allows you to create dynamic and interactive visualizations using built-in templates or creating completely custom visualizations. D3 makes use of Scalable Vector Graphics (SVG) to allow it to work with HTML and CSS. This also makes it easier to customize and configure as you can do so directly in a CSS stylesheet.
What can you create with D3?
D3 has several built-in templates you can use which are mainly for charting data to display in a historical/hierarchical way. Some popular examples include Bar charts, Scatterplot, Tree map, and Radial charts. You can find plenty of examples of these on D3’s website (see here).
This isn’t the only use case of D3, as it allows for custom visualizations where you can create just about anything you can think of. Since D3 uses SVG’s, creating a visualization can be as simple or complex as you’d like.
Custom Visualizations using D3
In this example I’m using Angular 14 and the D3 v7.9 NPM package.
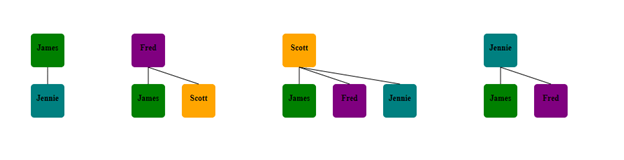
Using fake data, we can create a basic visualization showing nodes (People) and their relationships with each other (Friends). Below is the interface for the model I’m using. I have structured it as recursive since a person can have an unlimited number of friends. For simplicity, I’ve limited each person’s friends to only go one level deep since otherwise this example could go on forever.

Using this interface, we can dynamically generate a list of people and friends to display and draw boxes on the screen using D3 to represent each individual person. Then we can use lines to represent their relationships with each other. Each person is also displayed with their corresponding favorite color as the background.
Since D3 uses SVGs it allows us to have control over functions such as the scale & position of the SVG on the screen. This allows you to create a visualization with native functionality without the need to do much additional work. You can read more here about how you can implement zoom and pan into your visualization with examples.
Creating visualizations doesn’t have to be difficult. Tools like D3 reduce many of the challenges people face when creating visualizations for their applications. If you are struggling with creating the right visualizations for your apps, fill out the form below and someone will be in touch.
Thank you for reading! Make sure to subscribe to our blog so you don’t miss out on all our tips, tricks, and technology updates.

Discover More

Integration Between Power Platform and SharePoint Encourages Innovation
Organizations are focusing on innovation, streamlining their processes, and delivering better experiences for employees and customers. Power Platform and SharePoint are the Microsoft products that are helping organizations focus on…

Mastering Subagents in VS Code + Copilot: How To Actually Use Them
If you’ve ever dumped a giant problem into Copilot Chat and watched the conversation slowly turn into spaghetti, subagents are the feature you’ve been waiting for. Think of subagents as…

5 Common Misconceptions About Cloud Migration: Debunking the Myths
We’ve all heard of the cloud and cloud migration. But how important is it actually for your business? Organizations are moving to the cloud for several reasons: to improve agility,…

Let’s build something amazing together
From concept to handoff, we’d love to learn more about what you are working on.
Send us a message below or call us at 1-800-989-6022.