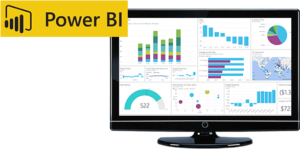
An Information Technology organization specializing in business solutions contacted Imaginet to create a more effective approach to their data reporting. They had been using Excel for reporting purposes and relied on manual manipulation of their data. Using Excel was neither effective nor efficient, and the manual work was leading to data quality issues. We determined the best solution for our client would be through Power BI reporting.
What We Did:
We recreated some of their existing reports in Power BI and created reports using data from Salesforce based on the following 2 requirements:
- Tracking service requirements – they are required to respond in a certain time frame to meet their targets.
- Sales forecasting report – future revenue and profit data needs to be accessible, as well as information about current opportunities they are exploring.
We changed their data reporting system report by report. To begin, we created the semantic model in Power BI and pulled in all the data they had from Salesforce, cleansed it, and transformed it so we could build reports. We also created one consolidated data set that could build the client’s two report requirements. Our Business Intelligence team generated several measures and calculated columns which allowed us to build reports from that information.
We also held weekly meetings and training sessions with our client. We would present the current state of the reports and they would provide feedback. If they were satisfied it met all requirements, we would mark the report as complete. If it was not fully meeting their requirements, we would modify it until our client was content. Involving our clients in the process is the best way we can ensure they are happy with all aspects of the solutions we provide.
Why Our Solution Was Helpful:
Our Power BI reporting solution led to a drastic improvement in data quality. The reports we created were more accurate compared to the previous Excel reports. When viewing the data in Salesforce and comparing it to the data in our reports, it was clear that data accuracy and quality were more aligned with the client’s needs.
Efficiency also improved. Everything is now fully automated, which eliminates the need for any manual data manipulation. The process is much quicker and allows them to meet monthly reporting requirements in a timelier manner.
Our client mentioned how helpful the training sessions and regular meetings were. They enjoyed being a part of the process, seeing the demonstrations, and understanding what phase we were in regarding the project.
We highly recommend using Power BI reporting for obtaining organizational data. The accuracy and quality of these reports can provide valuable insights, which lead to better business decisions.
Our team has been working hard these last few months, and we are excited to share our success with you. Don’t forget to subscribe to our newsletter to stay updated on our most recent Microsoft 365 projects. Fill out the form at the bottom of the page if you think Power BI reporting might benefit your organization.
Technologies Used
- Power BI

discover more
Innovation is key. But with our race to innovate, it’s tempting to focus on speed, features, and technical brilliance. But the most transformative software solutions often don’t begin with code, but rather conversation. People are drivers of innovation. At Improving…
Organizations are under a lot of pressure to modernize, scale, and innovate fast. Especially with how rapidly technology is evolving. Many people fall into the trap of thinking that all tech is good, and if you have any tech solution,…
It’s common for people to feel like technology creates distance or negatively affects connection. Technology is all about efficiency, efficiency, efficiency. But what if we shifted our mindset? Among all the negative thinking, we tend to forget that tech does…
Let’s Build Something Amazing Together
From concept to handoff, we’d love to learn more about what you are working on.
Send us a message below or drop us a line at 1-800-989-6022.

