
A major Canadian University had contacted Imaginet because they needed reports built on top of an existing data warehouse. This is a long-term client of Imaginet’s, and we had previously built a data warehouse for another department within the organization. Much of the work for this project was about defining the semantic data model on top of the data warehouse and then building the reports on it.
Before they had a data warehouse, they had multiple applications that were reporting data separately. Since the implementation of the data warehouse, the client wanted to use Power BI as a standard enterprise reporting portal.
Our Solution
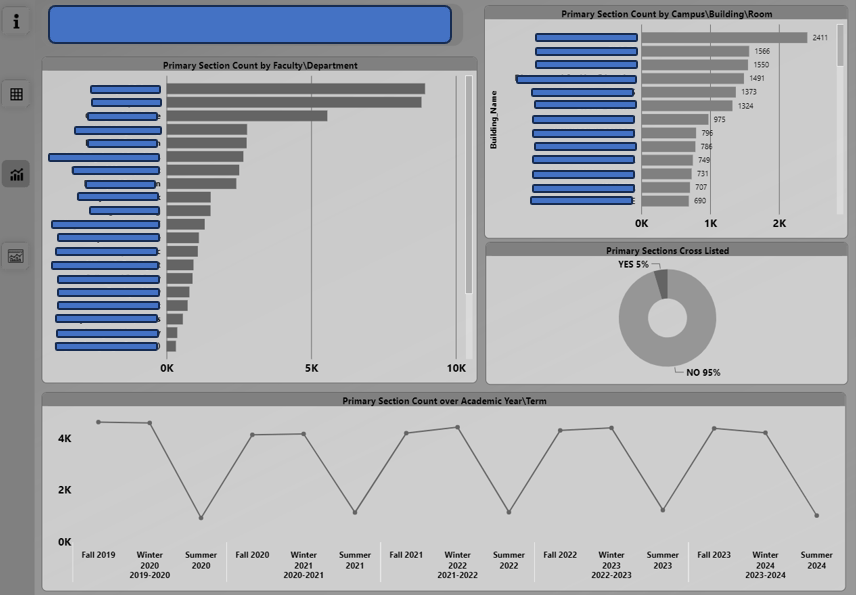
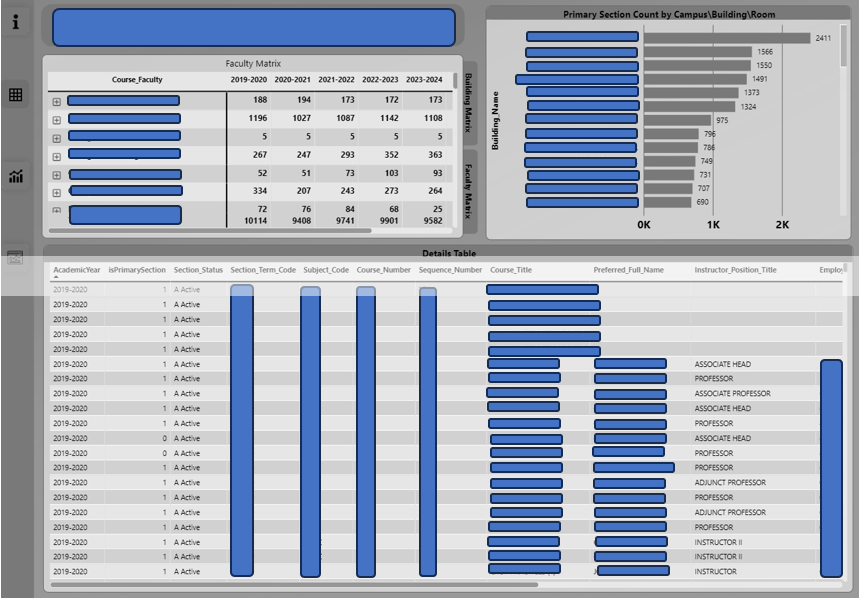
We started with creating views in the SQL data warehouse, then created a Power BI semantic model by importing the data through the views and specifying how those views related. The semantic model used business names for the tables and columns and hid any names that were only there for internal system purposes. This created a model that was easy to understand by business users and report authors who understood the business terms rather than the system or programmatic, technical terms. In the semantic model, we specified the measures that correctly summarized the numerical data in the model – for metrics like Head Counts (of instructors, courses, or students), and more complex calculations like percentages, derivations from targets, and time-intelligence measures (Year To Date measure that accumulate metrics for the year, or Previous Year metrics that compare a metric from one time period to another).
When the semantic data model is published in Power BI, then reports in Power BI are created from that semantic model to create visuals their desired KPIs and metrics.
We had taken on work from a previous vendor, which required us to determine what had already been done and what additional data and metrics needed to be added to the semantic model.
We ensured it was secure by implementing row-level security that allowed only relevant people the ability to view certain data reports.
The Benefit
The greatest benefit of this project is the client now has a Power BI semantic model that is clear, concise, and easily consumable by report authors and data analysts, and we can create reports that meet their needs quickly and easily with accurate data and saving valuable organizational resources. Additionally, with the previous vendor, our client was not seeing the outcomes they desired. With our help, we were able to provide them with a beneficial solution that lived up to their standards. The competence of Imaginet’s Data Engineering team allowed them to quickly see positive results.
Our team has been working hard these last few months, and we are excited to share our success with you. Don’t forget to subscribe to our newsletter to stay updated on our most recent Microsoft 365 projects. Fill out the form at the bottom of the page if your data is unreliable, you want to upgrade your data factory, or your data is difficult to manage.

discover more
With Microsoft’s introduction of the Modern experience in SharePoint, it can sometimes be difficult for users to distinguish between this new and more useful Modern interface and the original Classic experience. Fortunately, this article will provide a quick overview of…
One highly requested yet simple feature that has recently been added to Azure DevOps Services is the Work Item Parent Column feature. With this feature, you can now add a column to show the parent of a Work Item in…
Learn how to use personas to align cross-functional teams and create a unified customer experience. Our guide will help you understand the importance of personas, how to create them, and how to use them in your enterprise or B2B team.
Let’s Build Something Amazing Together
From concept to handoff, we’d love to learn more about what you are working on.
Send us a message below or drop us a line at 1-800-989-6022.